
The Spring Market is here! But is the market actually going to get better?
We are now three weeks into April, and we are officially past Easter, Passover, Eid and March Break. By all accounts, the Toronto real estate market should be in full swing. Yet this year feels different. Buyers feel restrained - they are either prioritizing other demands (work and personal), or they are waiting for their current property to sell, or they have a general lack of urgency to buy. After throwing my hands up in frustration, I have decided to look into the numbers to see what's going on.
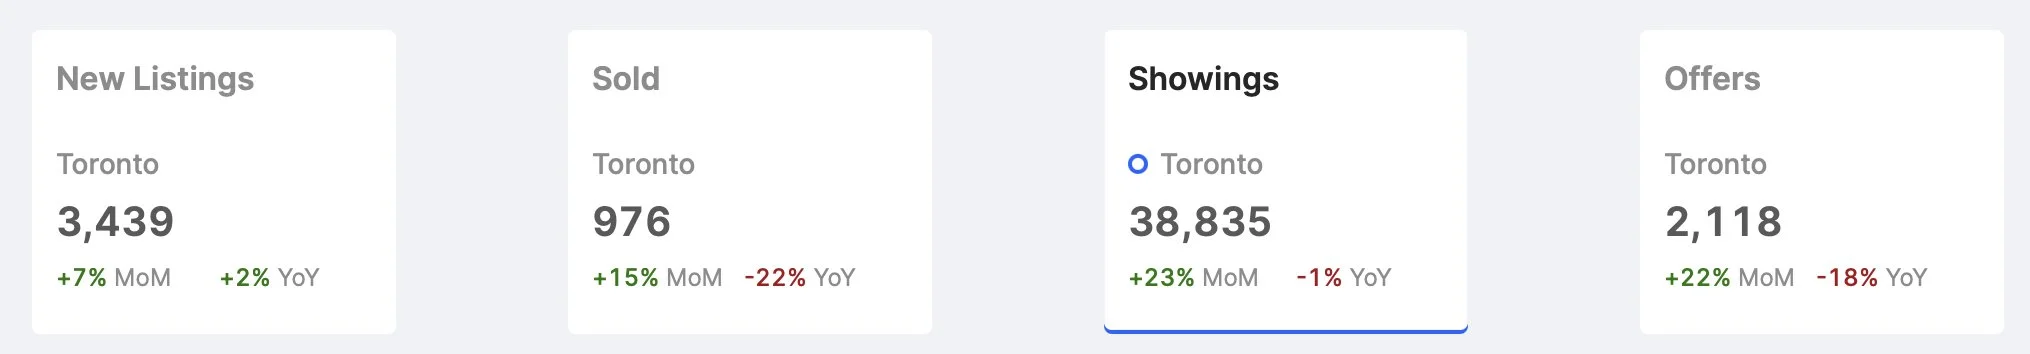
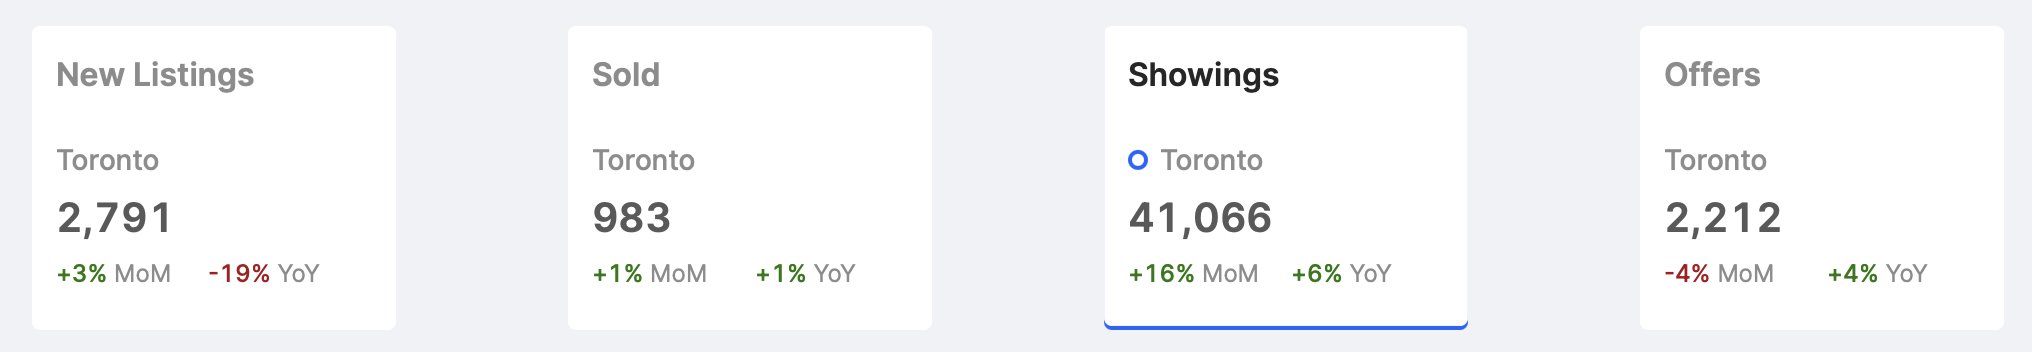
Brokerbay tracks buyer showings booked by real estate agents for every property in its system. Year-over-year showings are up 6%. Some of the growth may be due to increased adoption of the program among Toronto Brokerages; however, a 16% month-over-month increase in activity shows that buyer activity is on the rise. So far, there have been 41,000 showings in Toronto this month. There are still 11 days left in the month to reach the 69,000 and 67,000 showings we saw in April 2024 and 2025, respectively.
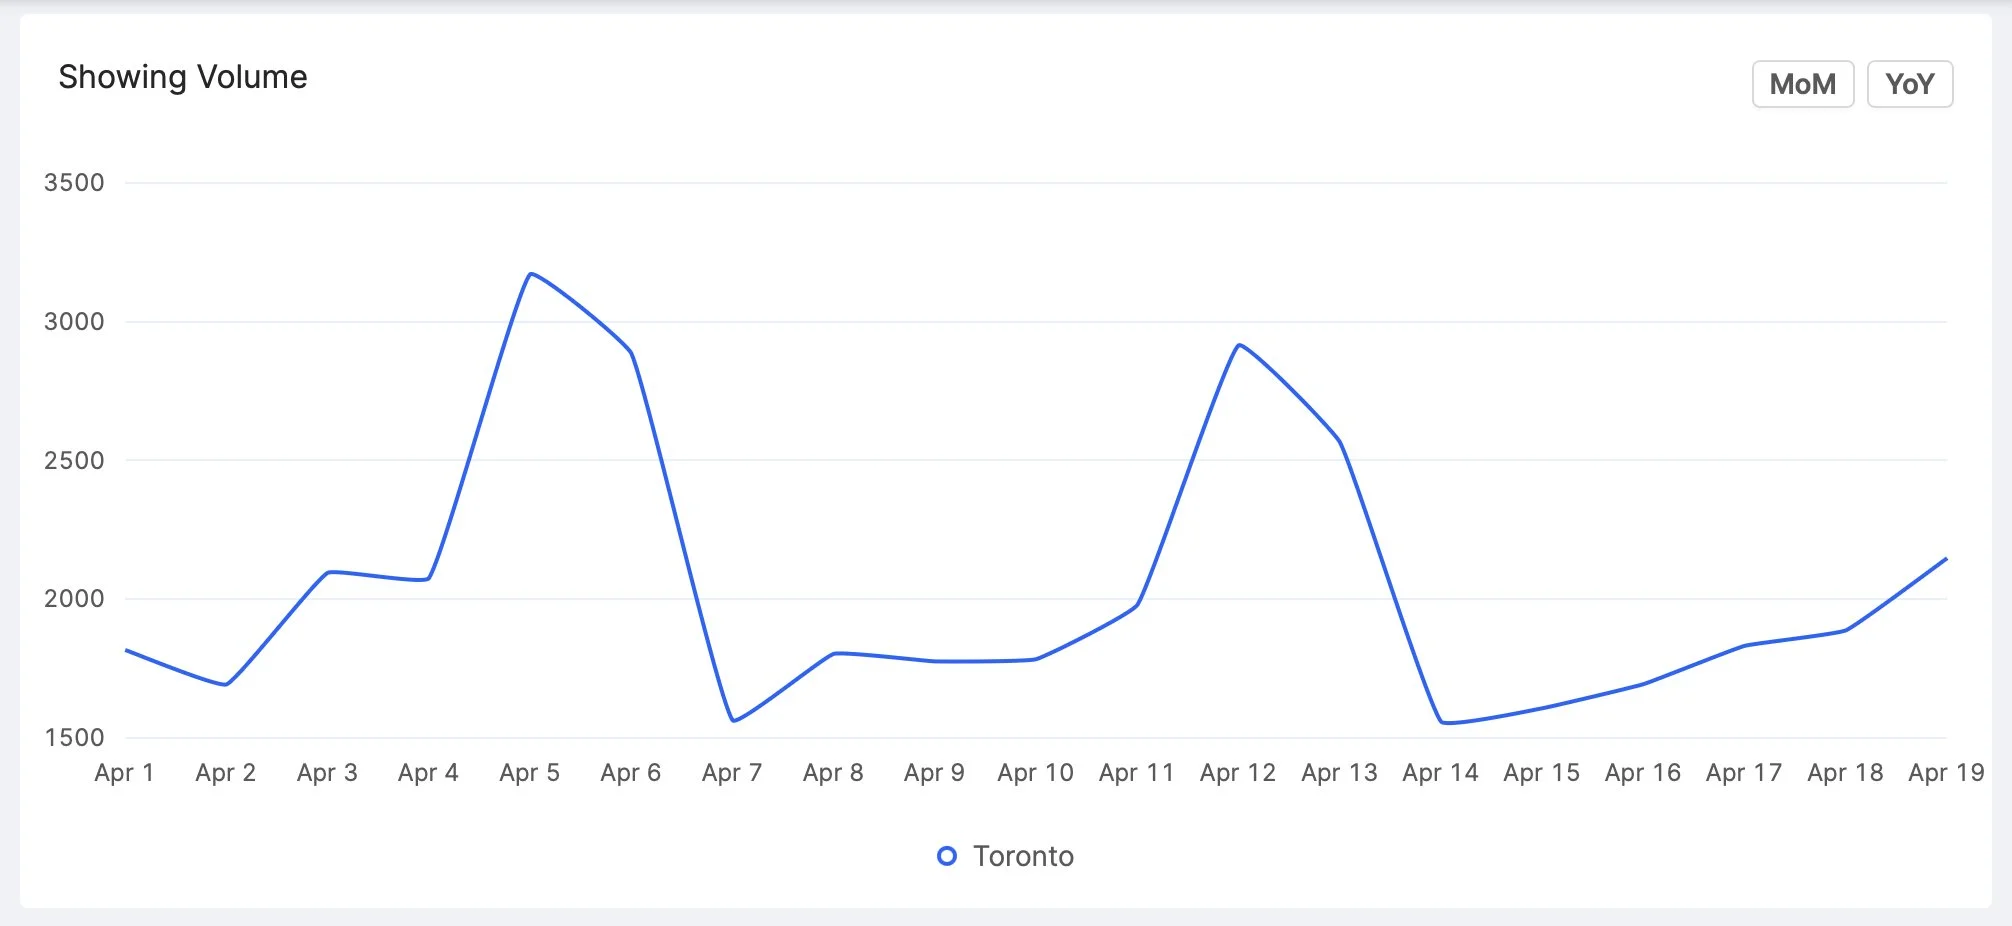
Showing Volume - Toronto - April 1-19, 2025 *edge.brokerbay.com
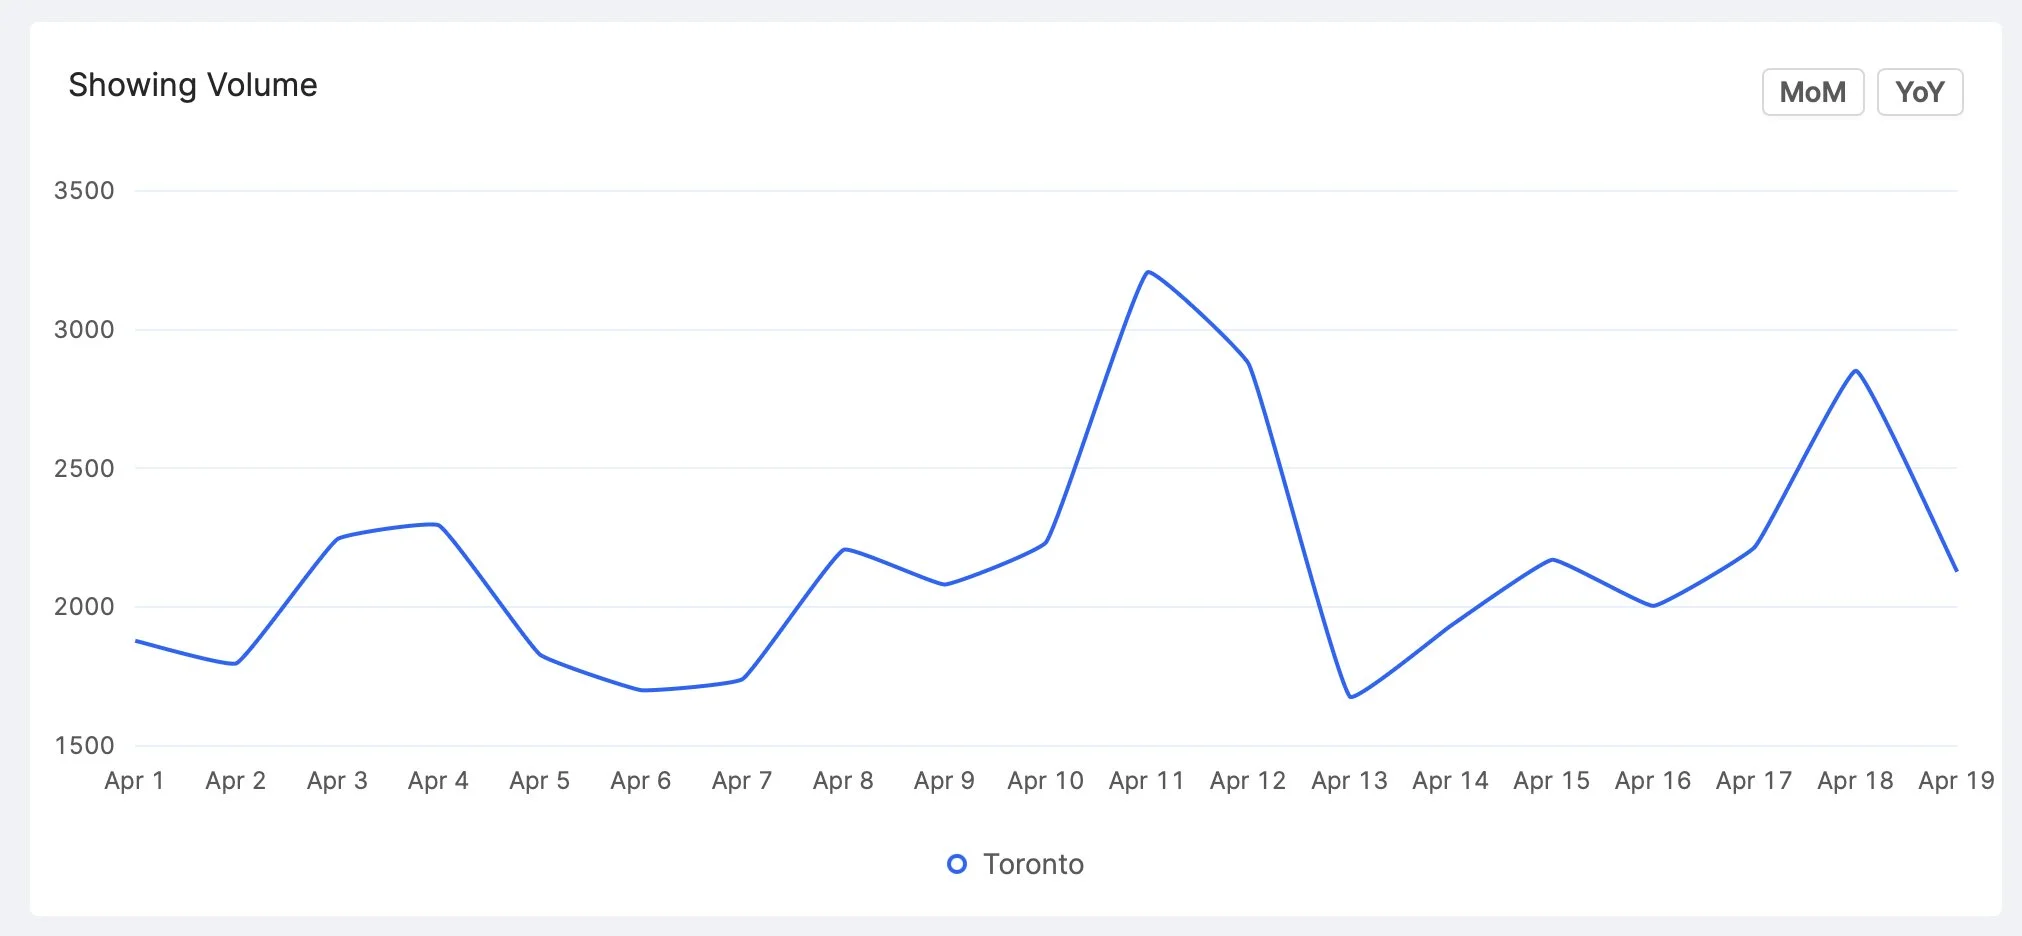
Showing Volume - Toronto - April 1-19, 2026 *edge.brokerbay.com
Despite the higher volume of active buyers, the number of offers registered on the platform has decreased from last month (-4%). Leading to only a modest increase in sales Y-O-Y (+1%) and M-O-M (+1%). So all these showings aren’t leading to as many buyers purchasing homes. I am seeing this on the ground level: buyers will be willing to see a home but hold off on making an offer due to the reasons listed earlier.
Activity - April 1-19, 2025 *edge.brokerbay.com
Activity - April 1-19, 2026 *edge.brokerbay.com
Diving into the TRREB Data, we see a similar story. Sales through the first few weeks of April are down 22% from last year (531 sales vs 683 sales), and prices are down 3.2% ($1,550,566 vs $1,601,726).
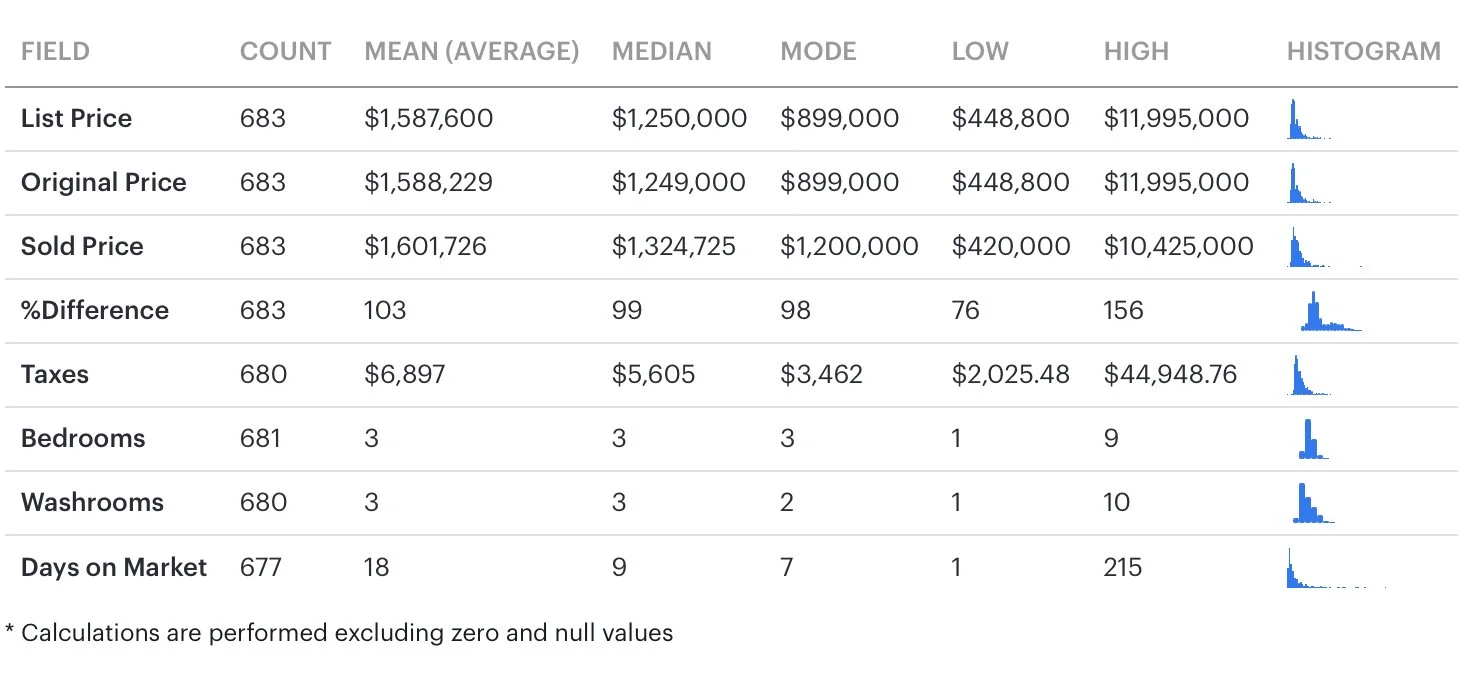
April 1-19, 2025 - TRREB Sales
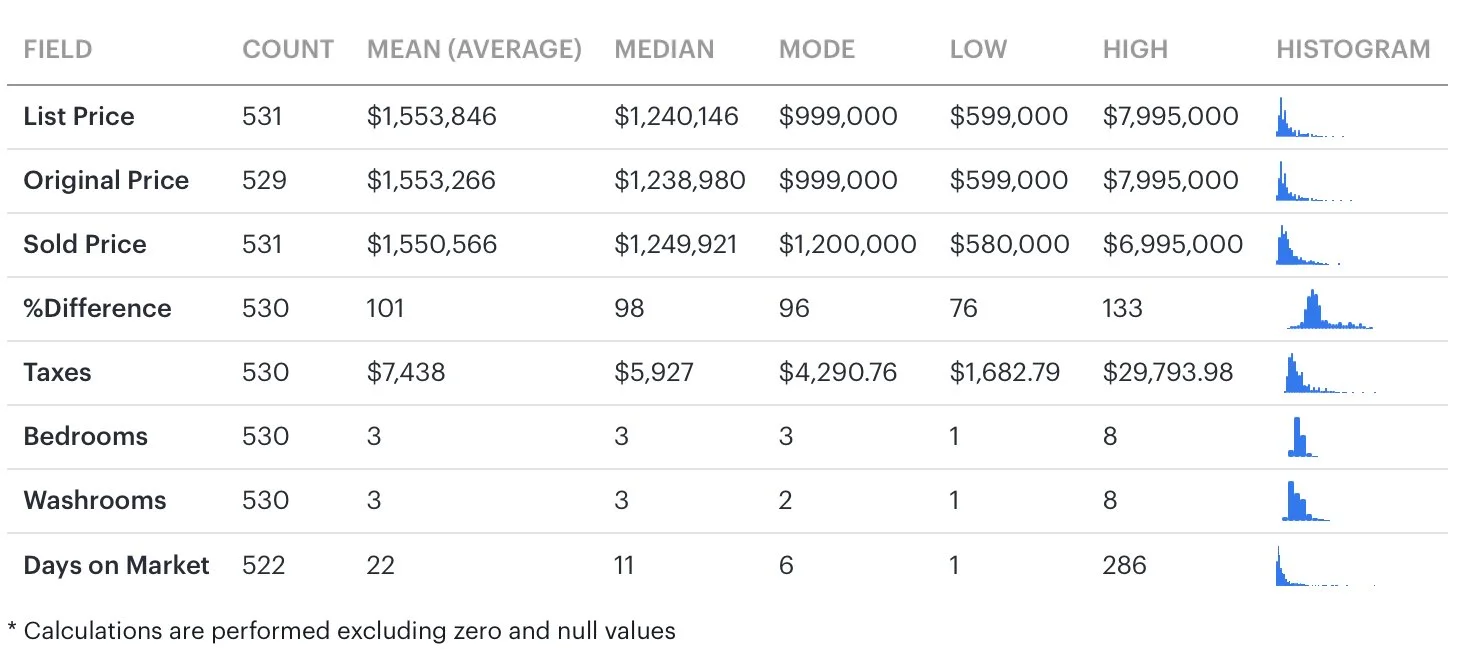
April 1-19, 2026 - TRREB Sales
It’s not all bad news for sellers. New Listings are declining through April as well, down 13.5% from the same period last year (1566 new listings vs 1811 new listings). Flat sales and lower new listings are leading to active inventory levels rolling over. If this continues, we could see the market tighten enough to stabilize prices.
We’ll have to wait for the final numbers for April to be tallied before any definitive conclusion can be made, but it's safe to say this Spring Market isn't starting with a bang.